In this video, we’re going to dive deep into Kibsi applications. Before we get started, you’ll want to watch Getting Started: Hello World and Getting Started: Core Concepts.
We will take what you built in the Hello World video and some of the ideas we shared in the Core Concepts video and put them together to build a real Kibsi application. But this time, we will build something more complex to learn more about Kibsi and produce a more interesting data model from our video stream. Watch our video below to get started.
Video transcription
For the app, we’re going to build today, we’re going to use a different public stream of a busy intersection located on Castro Street in San Francisco. But before we even open up our application designer, let’s look at this stream for a moment and think about it as a data model. Remember: the data model is the most important core concept. So instead of thinking about this stream in terms of the individual things that we want to detect, let’s think about what this stream would look like if it were converted into structured data.
So, we’ve certainly got all kinds of vehicles – cars and trucks. Eventually, we might see some buses and motorcycles. So those vehicles are interesting for our data model. We’ve got no shortage of people; they are walking on sidewalks and walking on crosswalks. I imagine some of these people will just cross the road wherever they want, whether they are in a crosswalk or not, so jaywalkers are a potentially interesting datapoint from the aspect of safety. Also, along the lines of safety, it would be interesting to know whenever a pedestrian and a vehicle are in the same crosswalk at the same time because that means either the pedestrian or the vehicle did something unsafe. We really should never have a pedestrian and a vehicle in the same crosswalk at the same time.
And, of course, we will need to detect individual vehicles and people to help produce those datapoints. But those individual detections are really just a small part of this data model that we want.
So now that we’ve put some thought into our data model, we can log in to Kibsi, open up the application designer, and start to build the application that will produce that data model.
First, we’ll click create application, name our application ‘intersection monitor’, and click create. Now let’s create our static item types. Remember, static item types are things that we know we don’t need to detect because they are always in the frame.
First, we’ll create a static item type for our Road, name it Road, and click save. Then we’ll repeat that for Crosswalk and Sidewalk static item types. Here, I’m also using the mouse wheel to zoom in and out in the designer to fit all of our items in the designer window.
Next, let’s create our detected item types. We’ll click the plus sign, choose detected item, name it pedestrian, use the search dialogue to choose the person detector, click next, ignore the enhancers here, we don’t need them for this app, and click save.
Now let’s organize our workspace a bit. Then click the plus sign again, choose add a detected item, and name it vehicle. Now, in this case, we’re going to use one detected item type called vehicle, but then we’re going to use four different detectors to define it. First, we’ll search for the CAR detector and select it. Then do the same for truck, bus, and motorcycle. When we’re finished, you can see we have one detected item type called vehicle that will detect cars, trucks, buses, and motorcycles with one detector.
Now let’s pause and look at our data model. At this stage, you can think of these five items sort of like TABLES in a database. So we have three tables to represent our Road, Sidewalk, and Crosswalk static items and two tables to represent our Pedestrian and Vehicle detected items.
Now let’s create some relationships between our items. On the Crosswalk item, click the plus sign and add a relationship attribute. Let’s call this first one Pedestrians in Crosswalk, target the Pedestrian item type, choose proximity, click next, choose bottom for our evaluation position to focus our detection more on the feet of our pedestrians, and then save our relationship.
Now let’s do the same thing for Pedestrians in the Sidewalk. On the Sidewalk item, click the plus sign, and choose relationship. Name it Pedestrians in Sidewalk, target the Pedestrian item type, choose proximity, click next, choose bottom for our evaluation position again to focus on the feet, and click save.
Now we expect to see vehicles in our Road, so let’s create that relationship the same way. Click the plus icon, choose relationship, name it Vehicles in Road, target the Vehicle item type, choose proximity, then bottom, and save the relationship.
Remember in our data model, we wanted to capture conflicts when vehicles and pedestrians are in the sidewalk at the same time, which is unsafe, as well as jaywalkers. That’s when a pedestrian is crossing the road but not using the crosswalk, which is also unsafe. So let’s create some relationships to ensure our data model is set up to give us that data when it occurs.
On our Crosswalk, let’s create a relationship to capture when a vehicle is in the crosswalk. Call it Vehicles in Crosswalk, target the Vehicle item type, choose proximity and bottom, and hit save.
Finally, let’s do the same thing on our Road item to capture when a pedestrian is in the road outside a crosswalk. Call it Pedestrians in Road, target the Pedestrian item type, choose proximity and bottom, and hit save.
Now let’s drag our items around and use the mouse wheel to zoom to get our workspace organized. Now we’ve turned our collection of tables into a relational database with all the relationships we need to capture the data we want.
Next, let’s add some attributes to our item types. Now, if a table of data consists of rows and columns, you can think about attributes as the columns in our data model, and the individual static items we deploy and the individual detected items that our application detects will be the rows in our data model.
So let’s add a count attribute to our Sidewalk item type to count the number of pedestrians detected per minute. Click the plus on the Sidewalk item type to add a new attribute, choose ‘count’, name our attribute Pedestrians per Minute, target the Pedestrians in Sidewalk relationship, specify the time interval of 1 minute, and click save.
Now let’s do exactly the same thing to count the number of pedestrians that use the Crosswalk item. Click the plus on the Crosswalk item type to add a new attribute, choose ‘count’, name our attribute Pedestrians per Minute, target the Pedestrians in Crosswalk relationship, specify the time interval of 1 minute, and click save.
Next, let’s add some counter attributes to count the number of vehicles that use the Road. Click the plus on the Road item type to add a new attribute, choose ‘count’, name our attribute Vehicles per Hour, target the Vehicles in Road relationship, specify the time interval of 1 hour, and click save.
Now, remember that our Vehicle detected item type will detect cars, trucks, buses, and motorcycles. So let’s create some counters for those. Again, click the plus sign on the Road item to add a new attribute, choose counter, name it Cars per Hour, target the ‘Vehicles in Road’ relationship, but this time click ‘add a filter’. Now click the KEL button to use the Kibsi Expression Language to define an expression that will only count cars. To do this, we’ll type dollar sign ($rel) which refers to the ‘Vehicles in Road’ relationship we specified on the previous step, then .type = CAR with car in single quotes and all caps. Then click save expression, specify the time interval of 1 hour, and click save.
Notice that our Vehicle item type actually doesn’t have an attribute called ‘type’ yet, but we need that to make the expression we just wrote work. So let’s add that now. On the Vehicle item type, click the plus sign, add a new ‘item class’ attribute, name it TYPE, and click save.
Now, any time we reference that TYPE attribute, like we did in our count expression a few moments ago, KIBSI will return the class of the item being detected – in this case, CAR, TRUCK, BUS, or MOTORCYCLE. So whenever our type = CAR, our count expression will count it.
Let’s create that same count attribute for TRUCKs. Click the plus sign on the Road item to add a new attribute, choose counter, name it TRUCKS per Hour, target the ‘Vehicles in Road’ relationship, but this time click ‘add a filter’. Now click the KEL button to use the Kibsi Expression Language to define an expression that will only count TRUCKS. To do this, we’ll type dollar sign ($rel) then .type = TRUCK with TRUCK in single quotes and all caps. Then click save expression, specify the time interval of 1 hour, and click save.
Now let’s repeat that count attribute for BUSes and MOTORCYCLEs, since you’ve already done it for CAR and TRUCK.
Next, let’s take a look at some state machine examples. A state machine allows us to define any number of states we expect to see our items in, like ‘pending, in progress, or completed’. And we can define whatever states we want, as well as the rules for when to transition to another state.
For our intersection data model, we are interested in identifying when pedestrians or vehicles engage in unsafe behavior. Therefore, let’s create state machines on those item types to reflect that data.
First, for our vehicle item type, click the plus sign and choose state machine. Call it “Safety State” and name our first state “Safe”. Click the plus sign to add it to our state machine. Notice that the icon on the state indicates that “Safe” is our default state, which we can change to another state if we like. Now, let’s repeat the process to add a state for “Unsafe”. Drag a line from the orange dot on the “Safe” state to the orange dot on the “Unsafe” state. This line makes it possible to transition from the “Safe” to the “Unsafe” state.
Click “Add Expression” to define the rule to trigger the transition. Click “KEL” to use the Kibsi Expression language. Notice that the available options are suggested below the KEL editor. Click the “CROSSWALK” option. Start typing “pedestrian” and notice that the “pedestrians in crosswalk” relationship will autocomplete, so go ahead and click that. Finally, add “dot length”, open/close parentheses, and “greater than zero”.
Since this state machine is on the vehicle item type, this will trigger the state change whenever there are more than zero pedestrians in the same crosswalk as the vehicle. That is, whenever that KEL expression evaluates to TRUE.
Once a vehicle transitions to the “Unsafe” state, there is no other state for it to transition to, and no rule for it to transition back to safe…so it will remain flagged in the “Unsafe” state for its entire lifecycle.
Click “Save Expression” and then “Save” to save the state machine.
Now, let’s do exactly the same thing for our pedestrian item type. Now, there are two ways a pedestrian can be unsafe. First, they can be in a crosswalk at the same time as a vehicle. Second, they can be a jaywalker. So we will create our state machine exactly the same way as we did for our vehicle safety state, only this time our KEL expression will be different.
First, we’ll simply type “road” to refer to the road relationship attribute on the pedestrian item. In KEL, if a list is empty, it will return FALSE, and if a list has one or more items in it, it will return TRUE. So simply putting “road” here is saying “if the road relationship has a road in it”, which means our pedestrian is in the road and therefore returns TRUE.
Next, type “OR” so we can include our other unsafe state. Again, notice we get some suggestions below the editor. Choose “Crosswalk. Vehicles in crosswalk”. Again, this will return TRUE whenever there are any vehicles in the “vehicles in crosswalk” relationship we defined earlier and false whenever there are no vehicles. Now, whenever a pedestrian is in the road OR in a crosswalk with a vehicle, the pedestrian will transition from “Safe” to “Unsafe” and remain there for the rest of its lifecycle.
Click “Save Expression” and then “Save” to save the state machine.
Finally, let’s add some events to our application to take some action whenever a crosswalk conflict or a jaywalker is detected in our data model. To do this, first click the plus sign and choose the event item type. Name it “Conflict” and choose the “Crosswalk” item type as the source. For the start condition, click KEL and enter “$source.pedestriansInCrosswalk and $source.vehiclesInCrosswalk”. Note that you can use the autocomplete suggestions for most of that expression. This expression will trigger the start of the “Conflict” event whenever the “pedestrians in crosswalk” relationship and the “vehicles in crosswalk” relationships are both not empty at the same time.
Remember, when a relationship is empty, it returns false, and when it is not empty, it returns true. So, if there was a vehicle in the crosswalk and a pedestrian in the crosswalk, then both of those relationships would each have 1 item in them. This statement effectively evaluates to “TRUE and TRUE”, which will trigger the event because we have the “and” operator in there. If either relationship is empty, it will return false, making the whole expression false and not triggering the start of the event.
Before going to the next step, go ahead and highlight and copy the expression you just made. Then click next to define our optional end condition. For this, again click the KEL tab, type “NOT”, then paste your previous expression between parentheses. This will effectively end your event whenever the opposite of the start event is true, i.e., when the pedestrians in crosswalk relationship and the vehicles in crosswalk relationships are empty.
Now, let’s click the boxes to save an image snapshot at the beginning and end of our event, then click save to create our “Conflict” event.
To trigger an event for our jaywalkers, again click the plus sign and choose the event item type. Name it “Jaywalker” and choose the “ROAD” item type as the source. For the start condition, click KEL and enter “$source.pedestriansInRoad”. This will simply trigger the event whenever the “pedestrians in road” relationship has one or more pedestrians in it and returns true. Like we did before, copy our expression, click next, then for our end condition, we can use “NOT” and paste our start condition in parentheses to end our “Jaywalker” event whenever the start condition is no longer true, i.e., when pedestrians finally get out of the road.
Now we have a complete data model with our top-level static items defined for roads, crosswalks, and sidewalks, detected items for pedestrians and vehicles (which includes 4 different kinds of vehicles), all the relationships needed for our data model, and quite a few interesting attributes for our data, including counts, types, and state machines. Finally, we have two events being triggered whenever we see Jaywalkers or Conflicts in our data model.
So, let’s go ahead and publish a new version of our application, provide some quick notes for this version, and click save. To deploy our app, click on the Kibsi icon in the upper left corner, then navigate to Sites in the upper right and click the plus icon to add a new site. Name our site “San Francisco”, choose PST for the time zone, and click save.
Next, we will add a stream to our site. To do this, click on “create stream”, name it “Castro Street”, and provide the URL of the Castro Street livestream which can be found in the video description below. For our snapshot image, save a screencap of the video stream to your local computer, browse to upload the snapshot to your stream, and then click “create”.
To deploy our app, click the “deployments” icon in the upper right corner, click “add application”, and choose the intersection monitor app that we just made. Click “configure deployment”, choose our most recent version, click “next”, choose our Castro Street stream, click “next”, and define two static items each for our road, crosswalk, and sidewalks. Name your roads “Road A” and “Road B”, and do the same for crosswalks and sidewalks. For each of the static items, carefully draw the regions you would like to use.
For Road A, use the area of the road closest to the camera, being careful to not overlap any sidewalk or crosswalk areas that you plan to define here in a moment. For Road B, do the same for the far road area. Note that you can click ENTER at any time while drawing a region to close the polygon to the first point, as well as the trash can icon to delete a polygon and start over. For Crosswalk A, specify the large crosswalk that is closest to the camera, and for Crosswalk B, configure the region of the far crosswalk. For sidewalks, use the closest sidewalk as Sidewalk A and the sidewalk across the street as Sidewalk B.
Now that we have named and defined static regions for two roads, two crosswalks, and two sidewalks, we are ready to launch our application. Click “launch”, then “continue”. We recommend letting the app run for a few hours or even overnight so that you can build up a lot of interesting data for both the live and historical views.
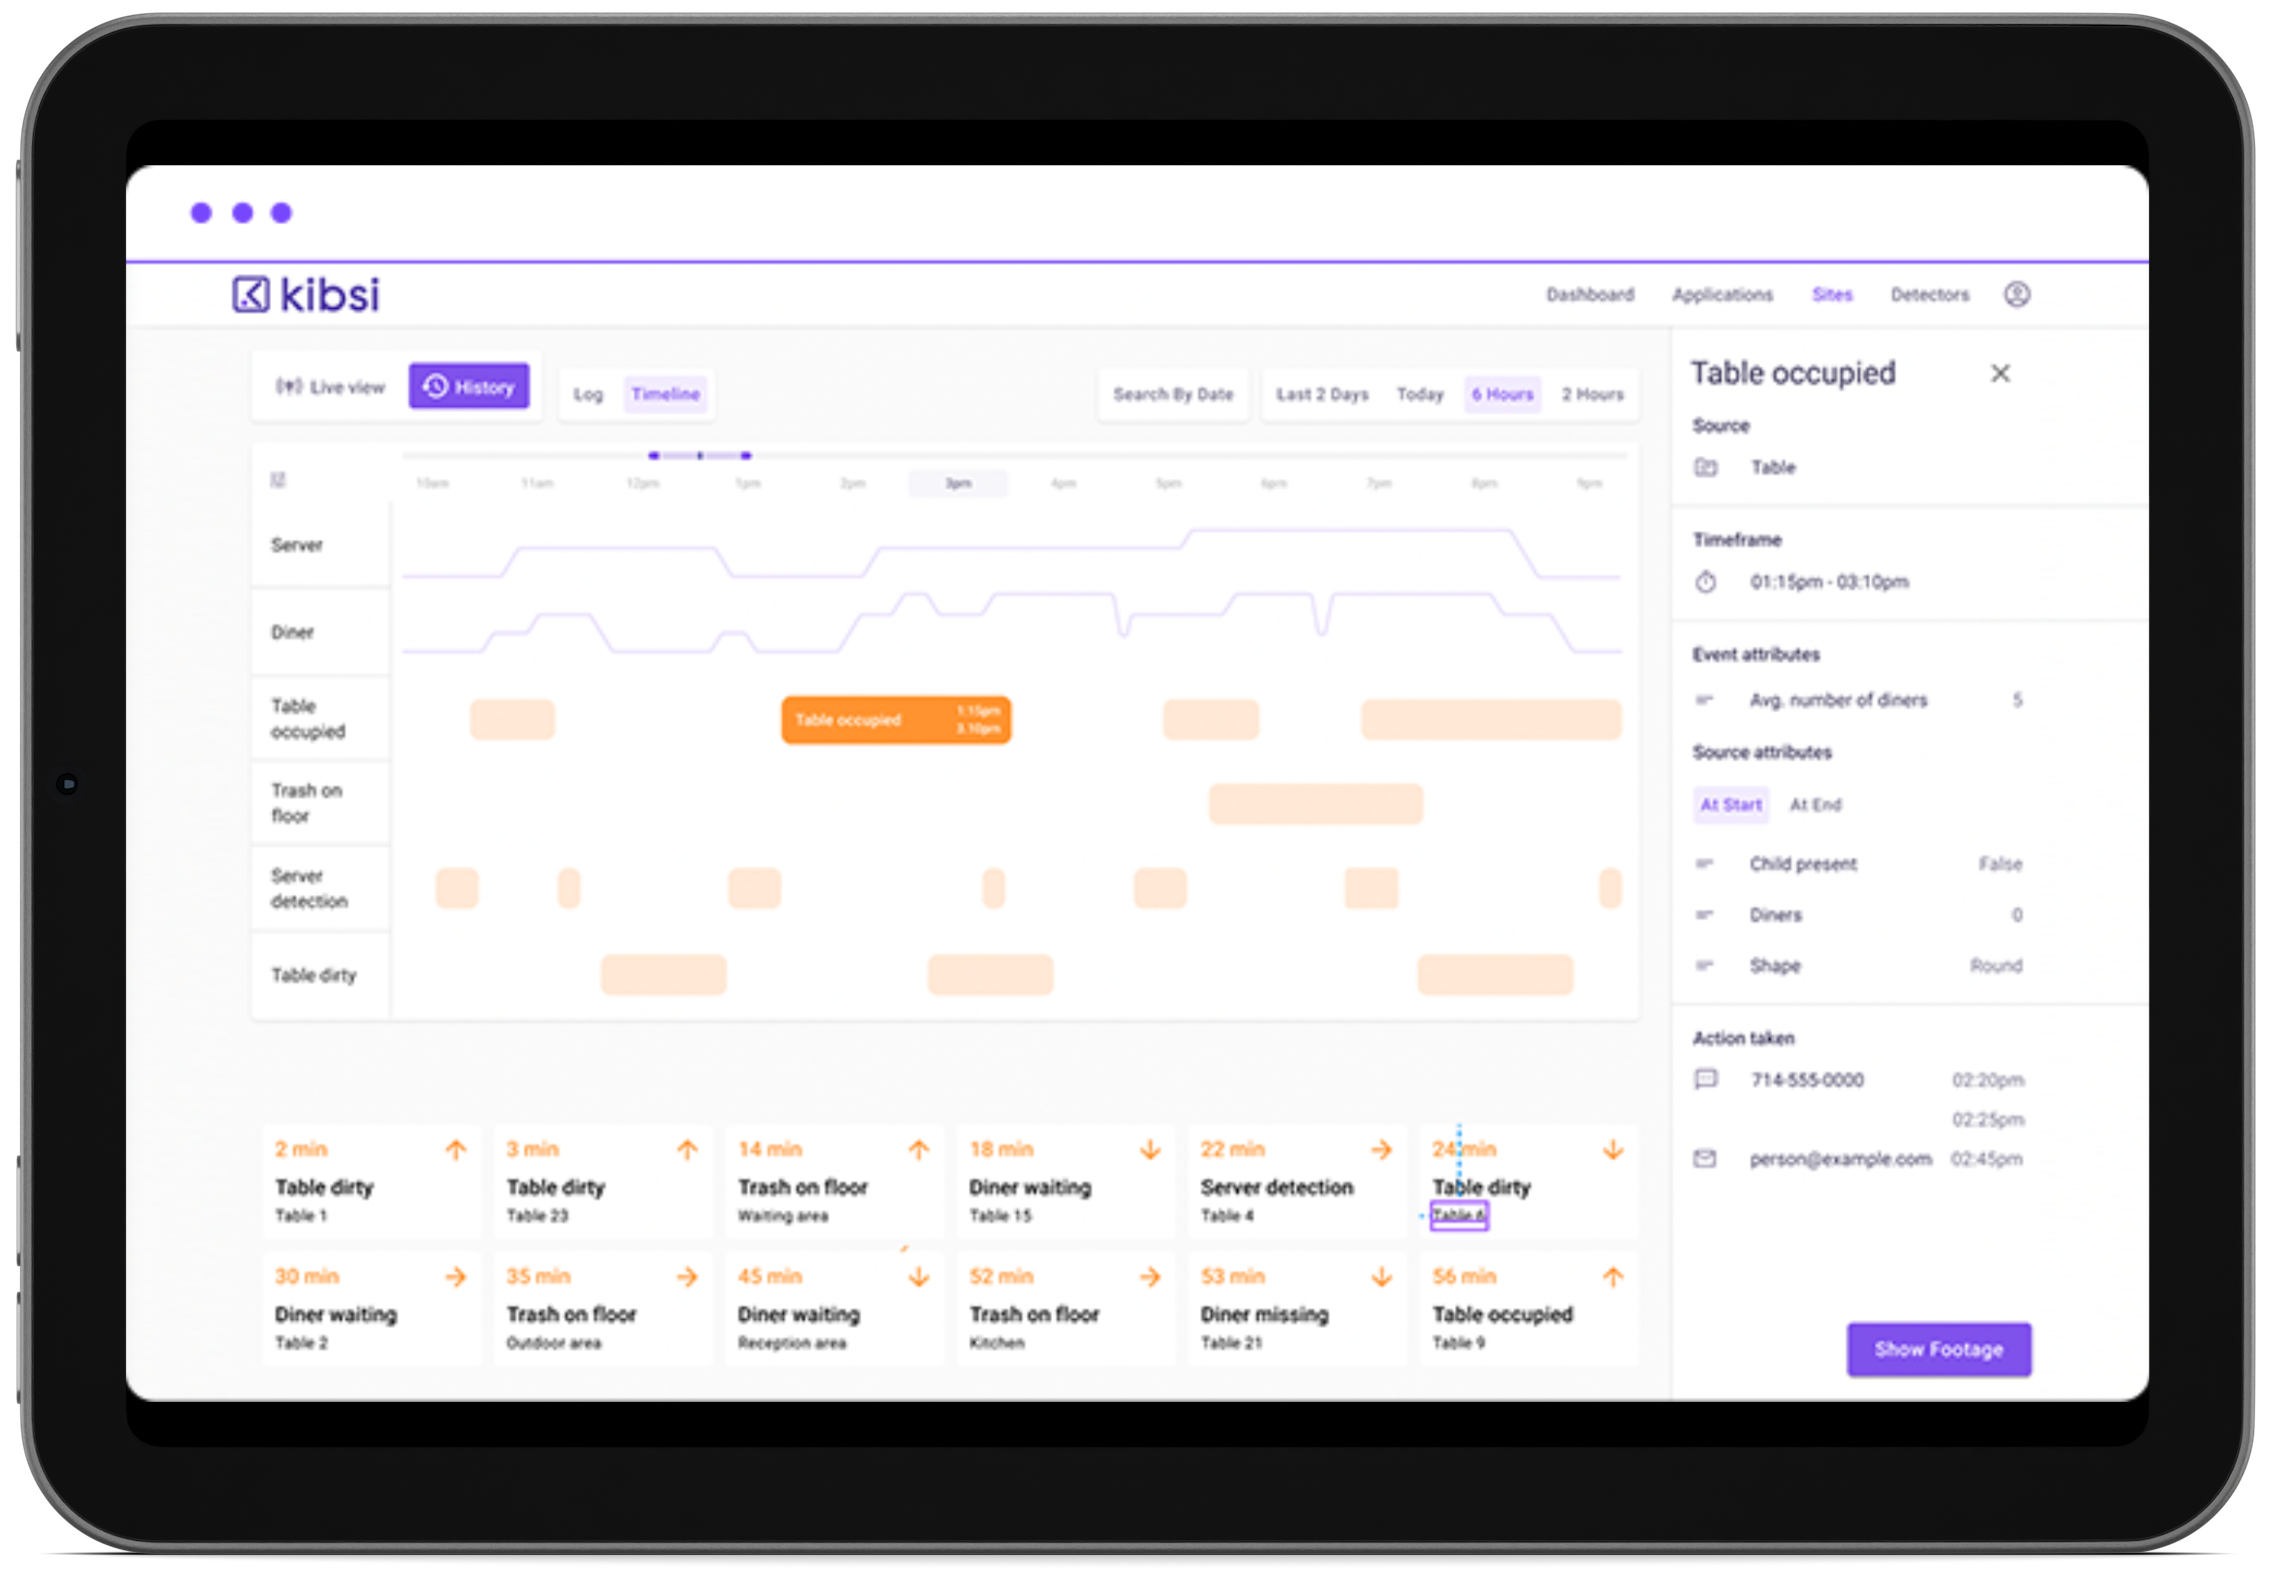
When you come back to review your data, there are a few things you will want to check out. On the live view, take a look at the road tab to see real-time data for vehicles, cars, trucks, buses, and motorcycles per hour for both our sections of road, Road A and Road B. On the crosswalk and sidewalk tabs, you will see pedestrian per minute data for all of our crosswalks and sidewalks. On the pedestrian tab, you will see every pedestrian detected, and their safety state from our state machine attribute. On the vehicles tab, you will see every vehicle detected, what kind of vehicle it is, and its safety state as well.
In the Individual Events panel up top, you can click on individual Conflict and Jaywalker events to see a snapshot of the data model at the time of the event and take a look at the image snapshot from both the start and end of the event. Here is an image of a jaywalker captured by our application, and here is an image of a crosswalk conflict, showing a vehicle and a pedestrian in the crosswalk at the same time. Both of these images were captured without having to train any custom models for either scenario and without having to manually scrub through hours of video data to get the snapshots of our events happening.
While you are looking at the live view, go ahead and open the video stream view, and click “show detections”. You can also resize and drag the viewer so that you can see the detections, the data stream, and the events all happening together in real-time. Spend some time clicking around on the histogram slices of the history view to see what the real-time data looked like for a particular time range. Again, use the tabs below to drill into the data.
Lastly, you can use the tabs below to explore different data views for crosswalk, road, sidewalk, pedestrian, and vehicle data.
Don’t forget to check out the visual debugger by clicking the ellipsis next to the deployment name and selecting your deployment from the dropdown menu. This feature allows you to understand how Kibsi works and see the data model in its raw form, updated in real-time. I recommend copying the events data by clicking the ‘copy’ icon and pasting it into a JSON editor (link provided in the video description) to explore the different items, relationships, attributes, and events you configured in your application.
This is an excellent way to familiarize yourself with your data model and explore it in an intuitive way.
And that concludes our intersection monitor application. In this video, we combined several Kibsi core concepts to create a functional Kibsi application that transforms a video stream of a busy intersection into useful data. It captures data about unsafe pedestrian and vehicle behavior and provides image snapshots for those safety events.
In addition, I’ve included links to a few other live streams of busy intersections in the video description so that you can have some fun configuring those as new streams in Kibsi and deploying your app to see how you can extract the same data model from a completely different stream without any changes to the application.
We hope you enjoyed this getting started video on Kibsi Applications. Be sure to check out the other videos in our Getting Started series.
Until next time, I’m Eric Miller from Kibsi. Thank you for watching!